Statistical Modeling

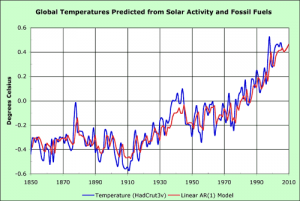
Statistical Modeling is the process by which events of interest are approximated using statistical methods and interpretation. The goal of statistics is to bring uncertainty and complexity into an organized form, allowing it to be quantified.[2] This can be very useful when trying to determine accuracy of collected data, or for approximating the course of an event which has not yet occurred. Though much of statistics can be performed without computers, technology plays a critical role in the ability to generate accurate and useful models for any amount of data.
Background
The main goal of statistical modeling is to be able to generalize to a population and expose the relationships between variables of interest. [3] This can be achieved in a number of way, using a variety of methods.
Generalized Approach
A typical research approach that can be applied to statistical modeling is the scientific method. It begins with a question and the desire to find an answer to the question. This can be formulated by an individual or group of researchers or by a company. It is important to formulate a strong hypothesis, as this will be the basis of the research being conducted. The next step is to decide what sort of data needs to be collected in order to help answer the question and provide enough evidence to accept or reject the hypothesis. The independent and dependent variables should be incorporated into the hypothesis to allow for a relationship between the variables (if any exists) to be exposed. The researcher then goes on to plan out a methodology for data collection. The methodology forms the basis of how the results may turn out, so the researcher focuses a large amount of time planning out an experiment that will be effective while also minimizing errors. The experiment is then executed and the data is tabulated. At this point, data can be quantified and an interpretation can be made.
The Hypothesis
The hypothesis is "an assumption about the population parameter."[4] It is based on background research and formulated accordingly. Usually, it will take the form of a null hypothesis and an alternative hypothesis, where the null implies that there is no significant statistical difference in the data and the alternative supports a significant difference. Statisticians will choose to either reject or accept the null hypothesis based on certain tests, which vary depending on the type of data collected.
Methods of Data Collection
There are two mains forms of data, qualitative and quantitative, and these can drastically affect the type of collection that needs to be done. Qualitative data takes the form of descriptions of what is being sampled, so naturally, the most common way of collecting qualitative data is observation. On the other hand, quantitative data involves numbers and is collected in a more mathematical method. [5]
Here are some common methods of data collection.
| Methods | Description |
|---|---|
| Census | Examines entire population[6] |
| Sample Survey | Examines a fraction of the population [6] |
| Experiment | Controlled method of data collection, based on causal relationships between sample groups[6] |
| Observational Study | Also examines causal relationships, but with less control over sample groups[6] |
These methods all have their uses in specific contexts, and it is up to the researcher to decide which method will be most effective to serve their purpose.
Data Analysis

Numerical Analysis
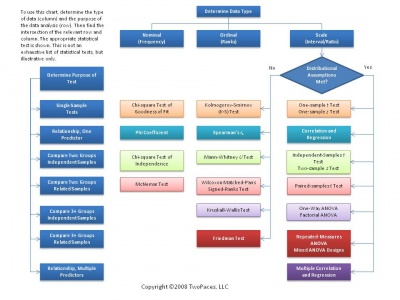
There are many ways of analyzing data numerically, with tests available for practically any type of data, grouping or sample. Some examples include using the mean, t-tests, ANOVA, or linear regression. The table at the right is very helpful for deciding what method of analysis to use. Some of the factors the determine which test is most appropriate include number of groups, paired or unpaired, as well as the specific type of data being analyzed. It is important to use the correct test as using an improper test would lead to incorrect results, and in some cases it is not possible to carry out the calculations. The overall goal of numerical analysis is to describe or compare one or more sets of data. Numerical analysis will typically yield a number which can be used along with values such as degrees of freedom and standard scores to make a conclusion about the hypothesis.
Graphical Analysis
Interpreting the Results
Uses
In Medicine
Recommender Systems
Recommender Systems are based on algorithms and statistical models which can be very complex. Their goal is to make suggestions to customers based on past search history or past purchased items. They can be found on retail sites like Amazon or music sites like Spotify.
Ethical Concerns
Avoiding Bias
Misleading Statistics
See Also
Data Mining
Data Aggregation Online
References
- ↑ Cobb, Loren. The Causes of Global Warming: A Graphical Approach. 2007. Photograph. n.p. Web. 9 Oct 2012. <http://tqe.quaker.org/2007/TQE158-EN-GlobalWarming-V1.html>.
- ↑ Kaplan, Daniel. Statistical Modeling: A Fresh Approach. 2nd ed. Saint Paul: Project Mosaic, 2012. vii. Print.
- ↑ http://www.sportsci.org/resource/stats/models.html
- ↑ http://stattrek.com/hypothesis-test/hypothesis-testing.aspx
- ↑ http://www.regentsprep.org/Regents/math/ALGEBRA/AD1/qualquant.htm
- ↑ 6.0 6.1 6.2 6.3 http://stattrek.com/statistics/data-collection-methods.aspx
- ↑ http://twopaces.com/stats_help.html