Difference between revisions of "Geographic Information Systems"
(more lead paragraph stuff) |
(addition of history) |
||
| Line 12: | Line 12: | ||
==History of GIS== | ==History of GIS== | ||
| − | The start of GIS practices can be traced back to London in the mid-1800s where | + | The start of GIS practices can be traced back to London in the mid-1800s where the city was in the midst of cholera epidemic due to rapid urbanization and poor sanitation methods. An anesthesiologist by the name of John Snow created maps charting these deaths caused by cholera. Not only was Snow able to stop the epidemic by removing the handle on a water pump but he was able to confirm that cholera was a disease that was transmitted through the consumption of contaminated water and that it was not an airborne disease. This also prompted a renewed effort to improve sanitation and the sewage infrastructure of London. By mapping the disease mortality of cholera, Snow applied the basics of geographic information systems. ''(It should be noted that geographic information systems can be created both through computer programs and on paper.)''<ref> https://www.ncbi.nlm.nih.gov/pmc/articles/PMC3174470/</ref> <br> |
| + | |||
==Applications of GIS== | ==Applications of GIS== | ||
Revision as of 00:06, 24 April 2017
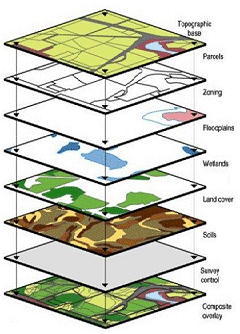
Geographic Information Systems (GIS) is a data analysis method that integrates hardware, software, and data for the analysis of geographically-concerned data[1]. GIS can be used to capture, store, check, and display data that is related to positions on Earth’s surface. By storing all of this information in one map, GIS enables people to more easily analyze and understand geographic patterns and relationships. While GIS is an essential and prominent aspect of modern mapmaking, or cartography, it also contains a large variety of data that cannot be displayed in a printed or onscreen map.[2] GIS can also be used for a diverse amount of functions beyond mapping, such as: accident and hot spot analysis, urban planning, transportation planning, environmental impact analysis, disaster management and mitigation, and navigation services for example.[3] The main concepts behind GIS can be related as these 4 simple ideas: create it, manage it, analyze it, and display it. [4] The birth of GIS has also led to discussions regarding the privacy, property, accuracy, and accessibility of information.
Contents
History of GIS
The start of GIS practices can be traced back to London in the mid-1800s where the city was in the midst of cholera epidemic due to rapid urbanization and poor sanitation methods. An anesthesiologist by the name of John Snow created maps charting these deaths caused by cholera. Not only was Snow able to stop the epidemic by removing the handle on a water pump but he was able to confirm that cholera was a disease that was transmitted through the consumption of contaminated water and that it was not an airborne disease. This also prompted a renewed effort to improve sanitation and the sewage infrastructure of London. By mapping the disease mortality of cholera, Snow applied the basics of geographic information systems. (It should be noted that geographic information systems can be created both through computer programs and on paper.)[5]
Applications of GIS
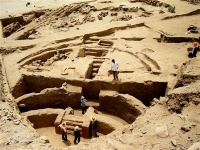
GIS is useful for any spatial analysis, and therefore has a wide range of uses. Two examples of such uses are academic researchers in archaeology or biology can utilize GIS to create 3d models of archaeological dig sites or to picture species distribution in an area[6]. There is a high demand for experts in GIS in a multitude of public and private sectors[7] due to the ability of GIS to utilize diverse types of datasets for the mapping and analysis of any spatial phenomena[8].
Archaeology
Due to the inherently destructive nature of archaeology, archaeologists find it helpful to plot their site in GIS, utilizing careful measurements to plot a 3d model of the artifacts they recover in the positions they were in before the dig. In doing this, they have a complete model to utilize year-round in research. This is helpful, because many conclusions made about a site of habitation depend on the relative location of artifacts to one another, e.g. many types of charred bones could indicate a hearth or a trash pile, while concentrations of domestic items could suggest a home or workspace[9].
Utility Companies
Utility companies deal with the distribution of electricity, water, etc. along networks. By mapping these networks in GIS, one is able to do spatial analysis to determine coverage deficiencies or best practices for expansion. The applications of GIS in this context have been referred to as the 4Ms: modeling, mapping, maintenance, and monitoring [10]
Ethical Implications
GIS Code of Ethics
Due to the fact that GIS is a multidisciplinary technical field, and that ethical codes are typically meant to serve only a single discipline or society, many ethical issues were not addressed. Mason and Collins pinpointed issues of privacy, property, accuracy, and accessibility to be the four main concerns regarding information sciences that need to be ethically acknowledged. In order to address these concerns, the Urban and Regional Information Systems Association (URISA) adopted a GIS code of ethics in 2003. The philosophy of the ethical code stems from the teachings of philosopher Emanuel Kant (1724-1804), who was a geographer in his day and was very familiar with maps as a form of communication. Kant’s basic moral ideas were to always treat others with respect and never as means to an end. He encouraged individuals to consider the impact of their actions on other people and to modify their actions accordingly. The main points of thef the GIS Code of Ethics that developed out of Kant's moral philosophy is summarized below:
1. Do the best work possible. 2. Contribute to the community. 3. Speak out about issues. 4. Have a professional relationship. 5. Respect others: [11]
Issues of Social Concern
Social phenomena that are measured like crime rates, poverty, education levels, segregation, etc. can be mapped spatially to serve as a tool for analysis. By providing a visual representation of geographic concentrations of various phenomena, correlations can be drawn and efforts can be focused on microcommunity-specific problems in order to affect maximum change
See Also
External Links
References
- ↑ what-gis http://www.gis.com/content/what-gis
- ↑ http://www.nationalgeographic.org/encyclopedia/geographic-information-system-gis/
- ↑ http://grindgis.com/blog/gis-applications-uses
- ↑ http://gisgeography.com/what-gis-geographic-information-systems/
- ↑ https://www.ncbi.nlm.nih.gov/pmc/articles/PMC3174470/
- ↑ who-uses-gis http://www.gis.com/content/who-uses-gis
- ↑ careers http://www.gis.com/content/careers-gis
- ↑ Colorado.edu http://www.colorado.edu/geography/gcraft/notes/datacon/datacon_f.html
- ↑ Stanford.edu http://www-sul.stanford.edu/depts/gis/Archaeology.htm
- ↑ Google http://books.google.com/books?vid=ISBN0849320976&id=ctWXJrDRf_AC&pg=PA1&lpg=PA1&ots=XxCU2Dm_0M&dq=GIS+Applications&sig=6whvFAGVG4SejGA9-Ys0HXddOqc#v=onepage&q&f=false
- ↑ Snow, M., Snow, R. Campus-Wide Information Systems. Ethics in the information exploitation and manipulation age (2007). 24.3 pg. 207-16.


