Difference between revisions of "Data Visualization"
| Line 4: | Line 4: | ||
</ref>. Today, computers can be used to process and display large amounts of data in a way that is efficient, easily accessible, and understandable. The human mind is visual by nature. As a result, visualization is found everywhere: ranging from lines and points on a graph to the standardized symbols called [https://en.wikipedia.org/wiki/Emoji emojis]. Whether the underlying information encompasses strict quantitative data or an individual's wish to convey a certain emotion, data visualization is, on a basic level, a method of communicating information and ideas<ref>Manuela Aparicio, Carlos J. Costa. “Data Visualization.” Communication Design Quarterly, November 2014.</ref>. | </ref>. Today, computers can be used to process and display large amounts of data in a way that is efficient, easily accessible, and understandable. The human mind is visual by nature. As a result, visualization is found everywhere: ranging from lines and points on a graph to the standardized symbols called [https://en.wikipedia.org/wiki/Emoji emojis]. Whether the underlying information encompasses strict quantitative data or an individual's wish to convey a certain emotion, data visualization is, on a basic level, a method of communicating information and ideas<ref>Manuela Aparicio, Carlos J. Costa. “Data Visualization.” Communication Design Quarterly, November 2014.</ref>. | ||
| − | As the amount of data accumulated due to the rise of the [https://en.wikipedia.org/wiki/Internet Internet] increasingly outsizes what existed before, the need to wrangle, process, and analyze this information has increased as well. Large industries and organizations particularly value the tools used to represent data because they enable decision makers to comprehend information and form an opinion in an efficient, profitable manner<ref>Few, Stephen. “Data Visualization - Past, Present, and Future,” n.d., 12.</ref>. Scientists must choose how they want to represent their data, as well as consider the audience they intend to show it to<ref>Healy, Kieran. Data Visualization: A Practical Introduction. Princeton University Press, 2018. | + | As the amount of data accumulated due to the rise of the [https://en.wikipedia.org/wiki/Internet Internet] increasingly outsizes what existed before, the need to wrangle, process, and analyze this information has increased as well. Large industries and organizations particularly value the tools used to represent data because they enable decision makers to comprehend information and form an opinion in an efficient, profitable manner<ref>Few, Stephen. “Data Visualization - Past, Present, and Future,” n.d., 12.</ref>. Scientists must choose how they want to represent their data, as well as consider the audience they intend to show it to because data visualization influences how people make sense of the information before them<ref>Healy, Kieran. Data Visualization: A Practical Introduction. Princeton University Press, 2018. |
| − | </ref> | + | </ref>. The processes and decisions which go into creating these representations have caused ethical concerns to arise regarding fairness, bias, and accountability. |
== History == | == History == | ||
Revision as of 17:56, 21 January 2022
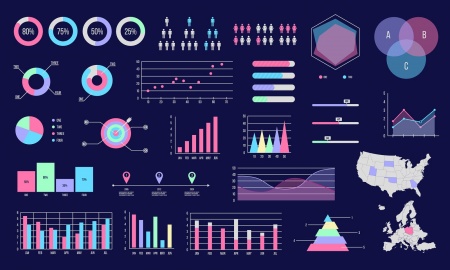
Data Visualization is defined as the design, development, and application of computer-generated graphical representation of data[1]. Today, computers can be used to process and display large amounts of data in a way that is efficient, easily accessible, and understandable. The human mind is visual by nature. As a result, visualization is found everywhere: ranging from lines and points on a graph to the standardized symbols called emojis. Whether the underlying information encompasses strict quantitative data or an individual's wish to convey a certain emotion, data visualization is, on a basic level, a method of communicating information and ideas[2].
As the amount of data accumulated due to the rise of the Internet increasingly outsizes what existed before, the need to wrangle, process, and analyze this information has increased as well. Large industries and organizations particularly value the tools used to represent data because they enable decision makers to comprehend information and form an opinion in an efficient, profitable manner[3]. Scientists must choose how they want to represent their data, as well as consider the audience they intend to show it to because data visualization influences how people make sense of the information before them[4]. The processes and decisions which go into creating these representations have caused ethical concerns to arise regarding fairness, bias, and accountability.
History
Content
References
- ↑ Sadiku, Matthew, Adebowale Shadare, Sarhan Musa, Cajetan Akujuobi, and Roy Perry. “DATA VISUALIZATION.” International Journal of Engineering Research and Advanced Technology (IJERAT) 12 (December 1, 2016): 2454–6135.
- ↑ Manuela Aparicio, Carlos J. Costa. “Data Visualization.” Communication Design Quarterly, November 2014.
- ↑ Few, Stephen. “Data Visualization - Past, Present, and Future,” n.d., 12.
- ↑ Healy, Kieran. Data Visualization: A Practical Introduction. Princeton University Press, 2018.
